Time Series Data Package - Darts

Easy Time Series Forecasting with Darts
Time series data plays a crucial role across many domains. Analyzing and forecasting time series data in fields such as finance, meteorology, manufacturing, and healthcare helps make important decisions. Python provides various libraries to perform these tasks effectively.
One such powerful tool is Darts. As the name suggests - “A library for various time series modeling and forecasting” - Darts is a robust toolkit for handling and predicting time series data in Python. Developed by Swiss company Unit8, this library is user-friendly and supports diverse models, allowing flexible responses to various types of time series data.
Key Features of Darts
Darts provides multiple functionalities related to time series. The diagram below shows various time series-related features offered by Darts, grouped by category.
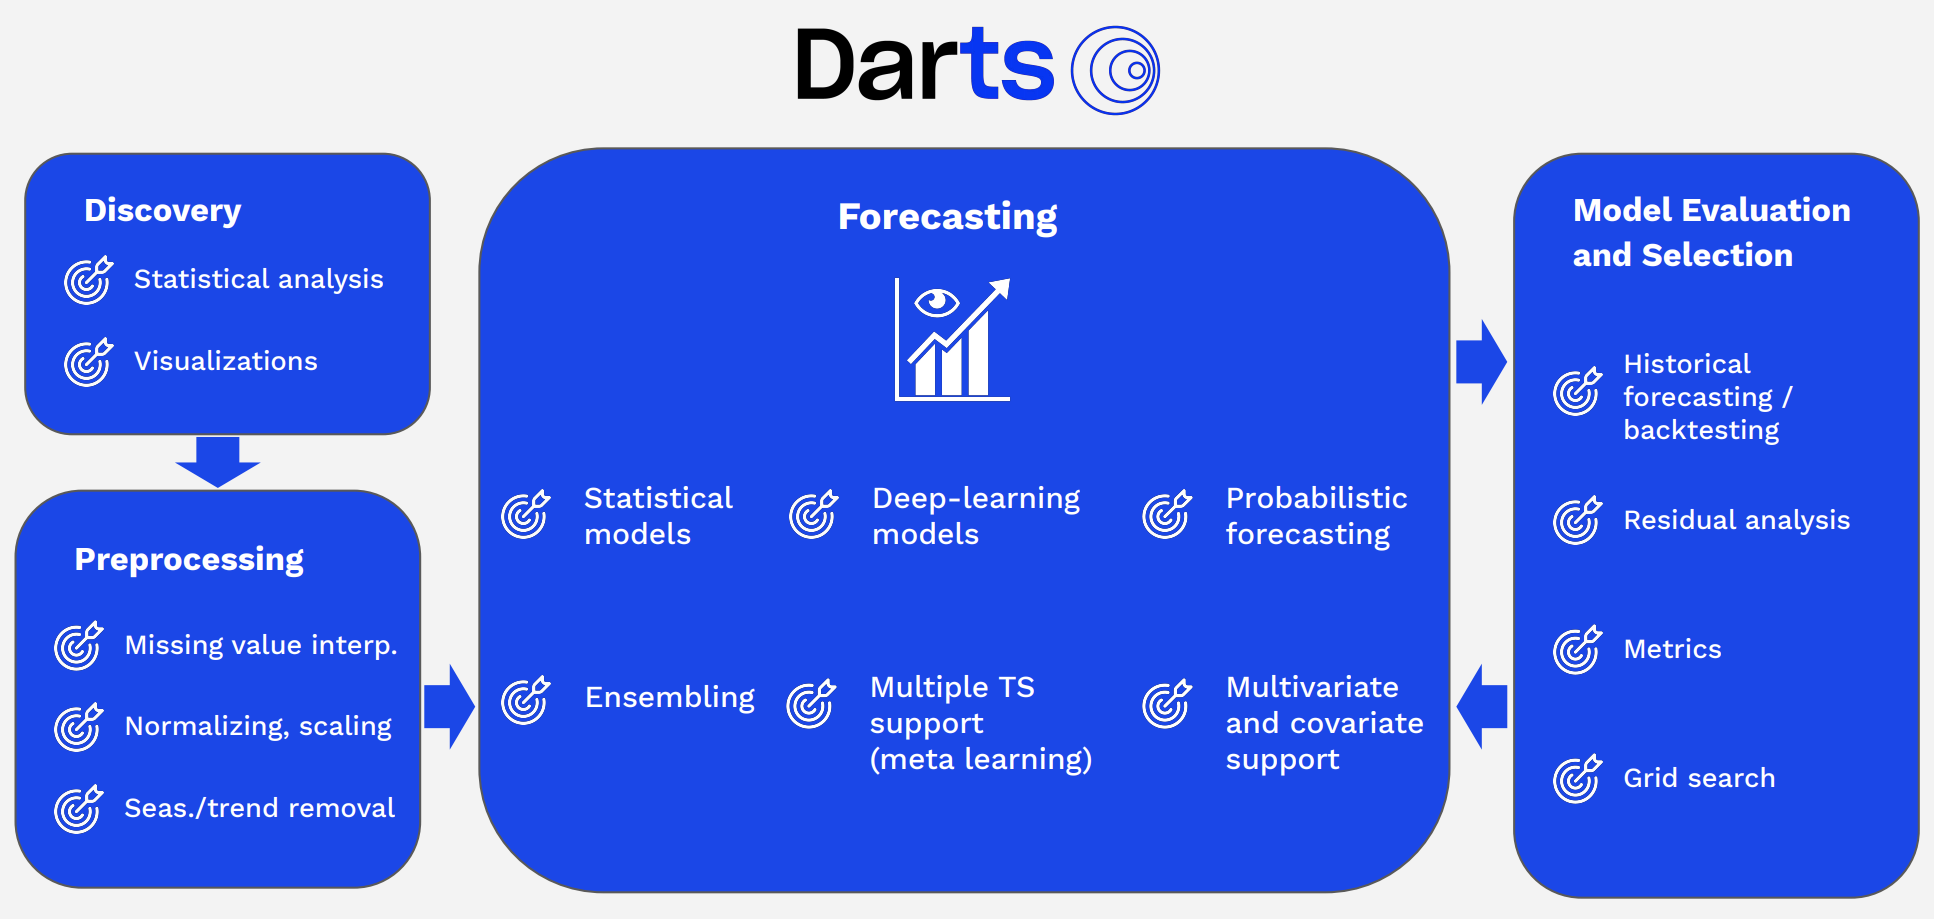
Time Series Modeling: Darts offers various time series models including ARIMA, Prophet, RNN, LSTM, TCN, and more. This allows users to select the most suitable model for their data.
Time Series Forecasting: With Darts, you can predict future values of time series data. It also provides confidence intervals considering prediction uncertainty.
Time Series Data Preprocessing: Darts provides various features for preprocessing and transforming data to prepare it before modeling. This includes data normalization, missing value handling, and outlier detection.
Time Series Decomposition: Darts can decompose time series data into trend, seasonality, and residual components to analyze patterns in each component. This helps better understand data characteristics and improve prediction models.
Validation and Evaluation: Darts provides various tools for evaluating and validating model performance. This helps verify and improve the model’s predictive capabilities.
In this post, we’ll explore how to use Darts to easily visualize/preprocess time series data and create a pipeline for experimenting with multiple models.
Time Series Data Visualization/Preprocessing with Darts
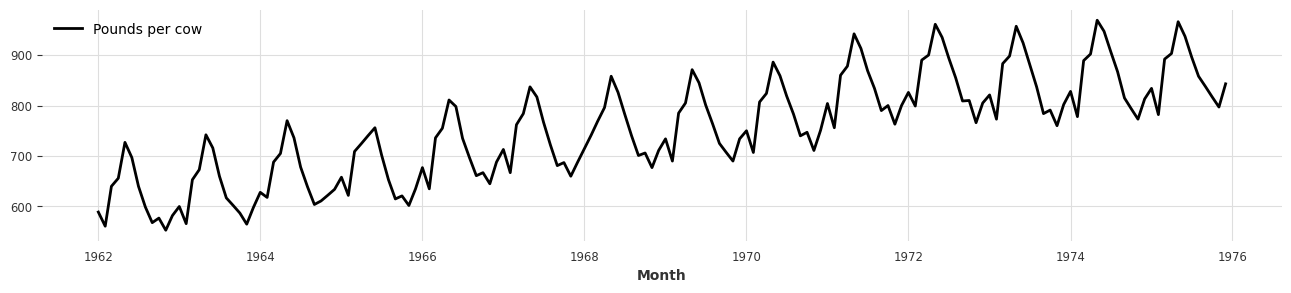
Data
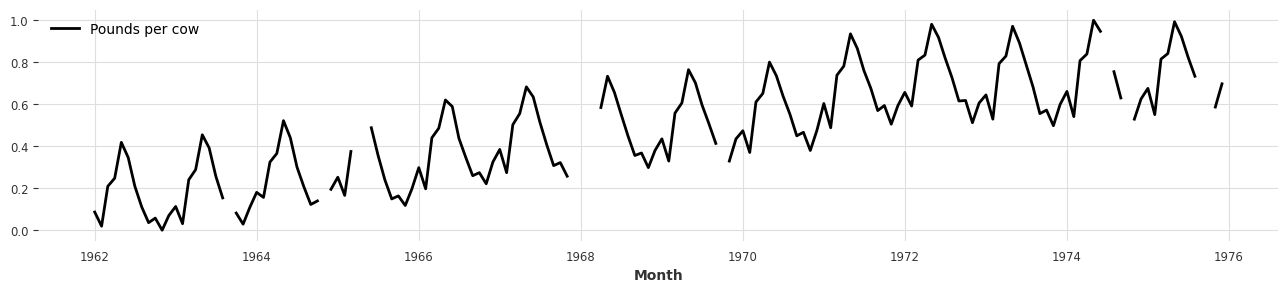
- First, let’s proceed with examples using one of the sample time series datasets that Darts provides by default.
- For this post, we’ll use the monthly milk sales dataset (
MonthlyMilkIncompleteDataset). - In Darts, all time series data is handled by converting it to the
TimeSeriesclass.
from darts.datasets import MonthlyMilkIncompleteDataset
import matplotlib.pyplot as plt
series = MonthlyMilkIncompleteDataset().load()

plt.figure(figsize=(16, 3))
series.plot();

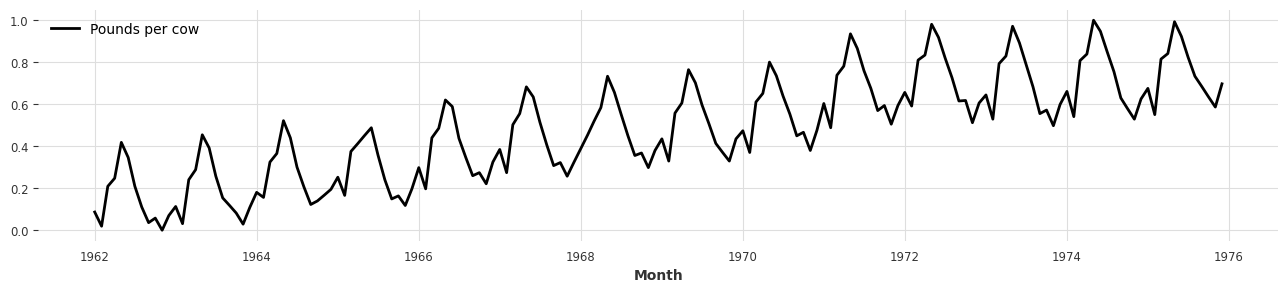
Scaler
- You can easily scale time series datasets using the Scaler class provided by Darts.
- The default Scaler is MinMaxScaler, and you can use your preferred scaling preprocessing method (e.g., StandardScaler, …).
- It works similarly to scikit-learn’s API: fit the Scaler with
fitand transform the actual time series data withtransform. - Using
inverse_transform, you can also restore scaled data back to its original form.
from darts.dataprocessing.transformers import Scaler

scaler = Scaler()
rescaled = scaler.fit_transform(series)

plt.figure(figsize=(16, 3))
rescaled.plot();
back = scaler.inverse_transform(rescaled)

plt.figure(figsize=(16, 3))
back.plot();
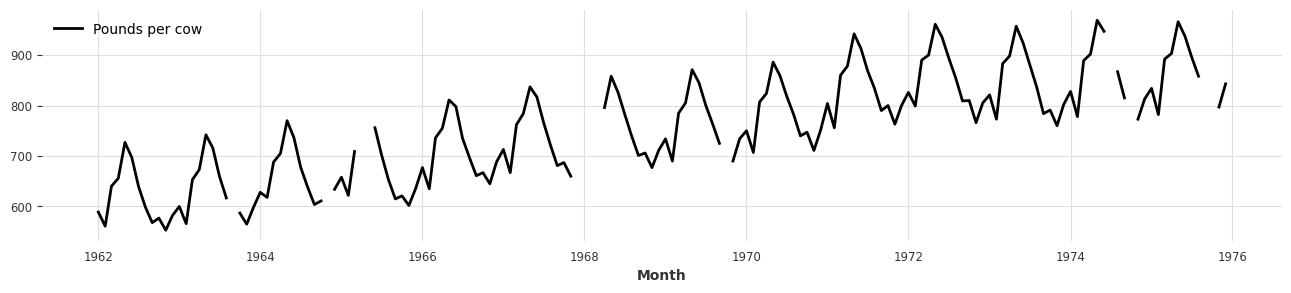
MissingValuesFiller
- When dealing with time series data, there are often many missing values throughout the dataset.
- You can interpolate these missing data points in various ways using the MissingValuesFiller class.
from darts.dataprocessing.transformers import MissingValuesFiller # type: ignore
series_missing = series.copy()

plt.figure(figsize=(16, 3))
series_missing.plot();

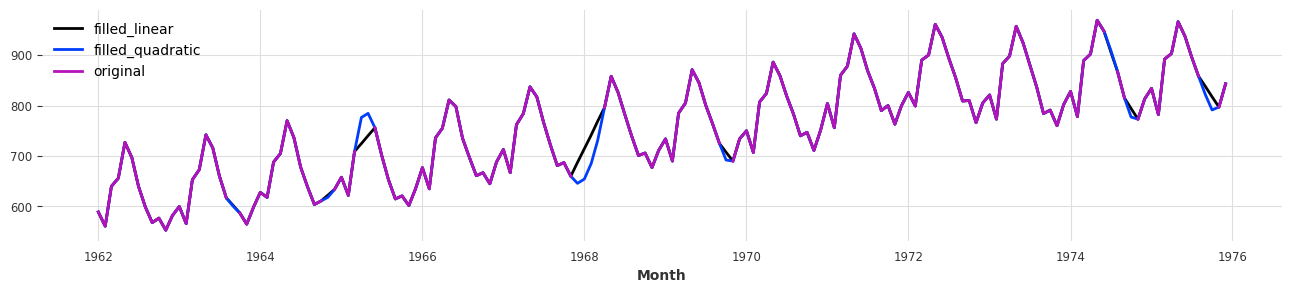
filler = MissingValuesFiller()
filled_linear = filler.transform(series_missing, method="linear")
filled_quadratic = filler.transform(series_missing, method="quadratic")

plt.figure(figsize=(16, 3))
filled_linear.plot(label='filled_linear')
filled_quadratic.plot(label='filled_quadratic')
series_missing.plot(label='original');
Pipeline
- When preprocessing time series data, you often use numerous preprocessing methods.
- As the number of preprocessing methods increases, managing preprocessing-related classes/variables becomes difficult, and deploying with the same preprocessing environment can present many challenges.
- To make this more convenient, Darts provides a data
Pipelinefeature similar to scikit-learn.
from darts.dataprocessing import Pipeline

incomplete_series = series.copy()

# Declare classes needed for data preprocessing
filler = MissingValuesFiller()
scaler = Scaler()

# Create Pipeline
pipeline = Pipeline([filler, scaler])
transformed = pipeline.fit_transform(incomplete_series)

plt.figure(figsize=(16, 3))
transformed.plot();
- If all features within the Pipeline support inverse_transform, the Pipeline itself can also perform inverse_transform.
- If the Pipeline contains features that don’t support inverse_transform (e.g.,
MissingValueFiller), you can setpartial=Trueto enable inverse_transform excluding those features.
back = pipeline.inverse_transform(transformed, partial=True)

plt.figure(figsize=(16, 3))
back.plot();
- Before moving to the next step, since Darts deep learning models need to handle float32 data types, we convert the transformed data to
np.float32.
import numpy as np
transformed = transformed.astype(np.float32)
Training Models with Preprocessed Data
- Once all training data is prepared, it’s time to set up the model.
- Darts provides various models from simple statistical models to complex deep learning models (from ARIMA to PyTorch Forecast).
- You can check all models provided by Darts at this link.
Darts Model Training Process
- When models are trained in Darts, they go through the following process:
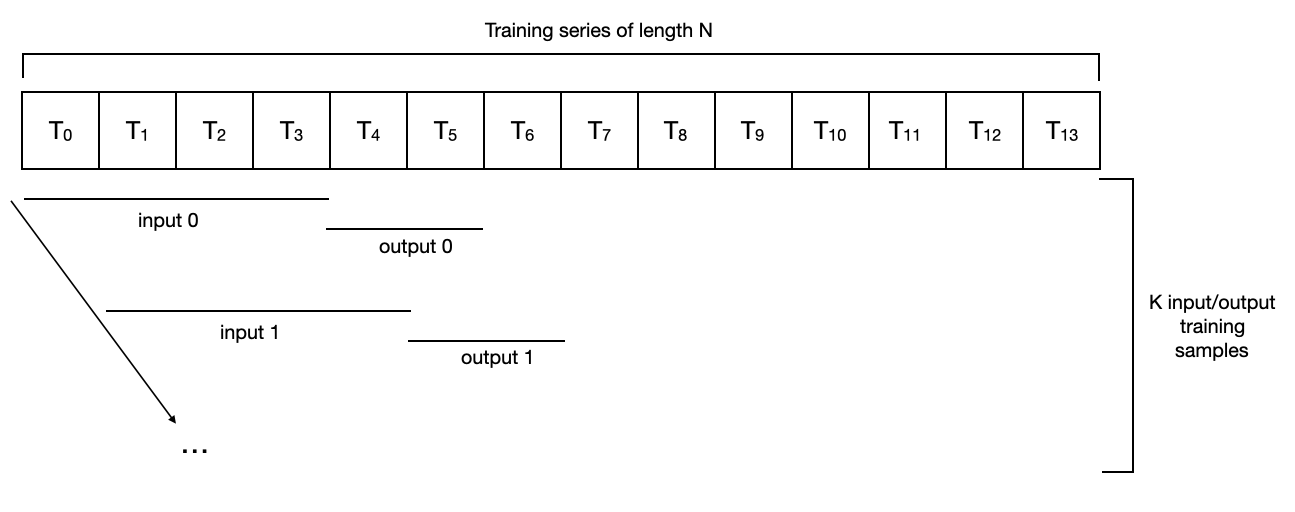
- Input data: Starting from the beginning of the data, cut input data by the set data size (
input_chunk_length), then continue cutting the same size while moving one step at a time (T0 ~ T3 / T1~T4 / …). - Output data: Starting from the step right after the input data, cut data by
output_chunk_lengthand continue moving in the same way as input data